
BSRN - previous CAMS Radiation Service validation
Validation CAMS Radiation Service - BSRN stations |
Date of the validation: May 2019
Illustration: list of the BSRN stations used for the validation => |
|
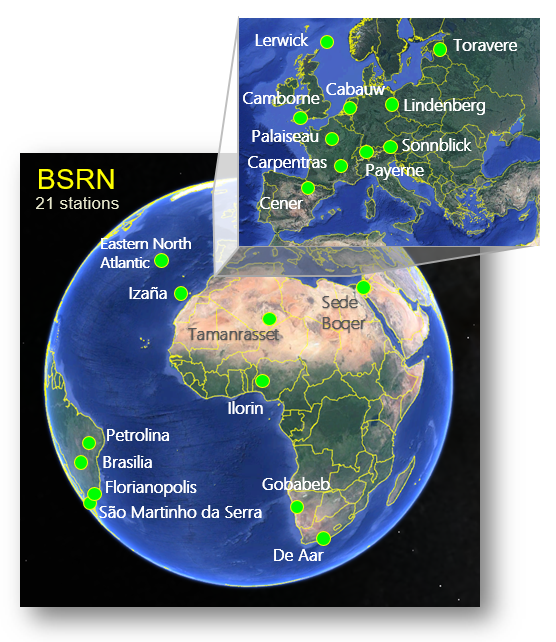
BSRN stations used in this validation
(Table 1: in decreasing latitudes)
| Station | Code | Country | Latitude | Longitude | Altitude (m) | Period | Type of Climate |
| Lerwick | LER | Scotland | 60.139 | -1.185 | 80 | 2004-02-01 to 2017-12-31 | Oceanic |
| Toravere | TOR | Estonia | 58.254 | 26.462 | 70 | 2004-02-01 to 2018-12-31 | Continental |
| Lindenberg | LIN | Germany | 52.210 | 14.122 | 125 | 2004-02-01 to 2017-12-31 | Continental |
| Cabauw | CAB | The Netherlands | 51.971 | 4.927 | 0 | 2005-01-01 to 2018-12-31 | Oceanic |
| Camborne | CAM | United Kingdom | 50.217 | -5.317 | 88 | 2004-02-01 to 2017-12-31 | Oceanic |
| Palaiseau | PAL | France | 48.713 | 2.208 | 156 | 2004-02-01 to 2018-12-31 | Continental |
| Sonnblick | SON | Austria | 47.054 | 12.958 | 3109 | 2013-01-01 to 2018-12-31 | Montaneous |
| Payerne | PAY | Switzerland | 46.815 | 6.944 | 491 | 2004-02-01 to 2013-12-31 | Continental |
| Carpentras | CAR | France | 44.083 | 5.059 | 100 | 2004-02-01 to 2018-12-31 | Mediterranean |
| Cener | CEN | Spain | 42.816 | -1.601 | 471 | 2009-01-01 to 2018-12-31 | Oceanic |
| Eastern North Atlantic | ENA | Spain | 39.091 | -28.029 | 15 | 2013-01-01 to 2013-12-31 | Oceanic |
| Sede Boqer | SBO | Israel | 30.860 | 34.779 | 500 | 2004-02-01 to 2012-12-31 | Desertic |
| Izaña | IZA | Spain | 28.309 | -16.499 | 2373 | 2009-01-01 to 2018-12-31 | Oceanic Montaneous |
| Tamanrasset | TAM | Algeria | 22.790 | 5.529 | 1385 | 2004-02-01 to 2018-12-31 | Desertic |
| Ilorin | ILO | Nigeria | 8.533 | 4.567 | 350 | 2004-02-01 to 2005-12-31 | Equatorial |
| Petrolina | PTR | Brazil | -9.068 | -40.319 | 387 | 2008-01-01 to 2017-12-31 | Subtropical |
| Brasilia | BRB | Brazil | -15.601 | -47.713 | 1023 | 2008-01-01 to 2015-12-31 | Subtropical |
| Gobabeb | GOB | Namibia | -23.561 | 15.042 | 407 | 2012-01-01 to 2018-12-31 | Desertic |
| Florianopolis | FLO | Brasilia | -27.605 | -48.523 | 11 | 2013-01-01 to 2018-12-31 | Subtropical |
| Sao Martinho da Serra | SMS | Brasilia | -29.443 | -53.823 | 489 | 2008-01-01 to 2017-12-31 | Subtropical |
| De Aar | DAA | South Africa | -30.667 | 23.993 | 1287 | 2004-02-01 to 2018-12-31 | Desertic |
GHI and DNI CAMS Radiation validation results - monthly, daily, hourly and 15 min sampling rates
(Click on the following link to show the corresponding statistics)
Monthly GHI
| CAMS-Radiation -- GHI Quality assessment results vs. the stations MONTHLY IRRADIATION |
||||||
| Station | Number of values | Mean station (kWh/m2) |
Bias (kWh/m2) (relative in %) |
STDEV (kWh/m2) (relative in %) |
RMSE (kWh/m2) (relative in %) |
Correl. coeff. |
| Lerwick | 129 | 65.70 | -1.83 (-2.79%) | 3.79 (5.78%) | 4.21 (6.42%) | 0.997 |
| Toravere | 175 | 75.43 | -0.37 (-0.49%) | 5.23 (6.94%) | 5.25 (6.96%) | 0.996 |
| Lindenberg | 156 | 91.19 | 1.25 (1.37%) | 4.76 (5.22%) | 4.92 (5.39%) | 0.997 |
| Cabauw | 164 | 90.62 | 4.59 (5.06%) | 4.65 (5.13%) | 6.53 (7.21%) | 0.998 |
| Camborne | 117 | 92.10 | 3.28 (3.56%) | 4.04 (4.39%) | 5.20 (5.65%) | 0.998 |
| Palaiseau | 147 | 98.27 | 3.20 (3.25%) | 4.77 (4.85%) | 5.74 (5.84%) | 0.997 |
| Sonnblick | 63 | 98.23 | -1.68 (-1.71%) | 17.89 (18.21%) | 17.96 (18.29%) | 0.949 |
| Payerne | 117 | 99.94 | 4.50 (4.50%) | 4.79 (4.79%) | 6.57 (6.58%) | 0.997 |
| Carpentras | 165 | 128.69 | 1.68 (1.30%) | 3.23 (2.51%) | 3.64 (2.83%) | 0.999 |
| Cener | 107 | 118.50 | 1.67 (1.41%) | 7.37 (6.22%) | 7.56 (6.38%) | 0.993 |
| ENA, Azores | 0 | NaN | NaN (NaN%) | NaN (NaN%) | NaN (NaN%) | NaN |
| Sede Boqer | 100 | 168.22 | -5.61 (-3.34%) | 5.05 (3.00%) | 7.55 (4.49%) | 0.997 |
| Izana, Tenerife | 115 | 198.76 | -4.65 (-2.34%) | 7.26 (3.65%) | 8.62 (4.34%) | 0.993 |
| Tamanrasset | 176 | 168.88 | -5.54 (-3.28%) | 4.67 (2.77%) | 7.25 (4.29%) | 0.994 |
| Ilorin | 14 | 127.58 | 8.77 (6.87%) | 5.13 (4.02%) | 10.16 (7.96%) | 0.964 |
| Petrolina | 102 | 152.56 | 8.10 (5.31%) | 4.39 (2.88%) | 9.21 (6.04%) | 0.989 |
| Brasilia | 71 | 142.41 | 5.19 (3.65%) | 4.63 (3.25%) | 6.95 (4.88%) | 0.988 |
| Gobabeb | 76 | 197.15 | -9.66 (-4.90%) | 3.42 (1.74%) | 10.25 (5.20%) | 0.999 |
| Florianopolis | 54 | 127.96 | 0.81 (0.63%) | 4.13 (3.23%) | 4.21 (3.29%) | 0.993 |
| Sao Martinho da Serra | 98 | 137.19 | -0.34 (-0.25%) | 5.27 (3.84%) | 5.28 (3.85%) | 0.994 |
| De Aar | 53 | 172.96 | -3.94 (-2.28%) | 2.36 (1.36%) | 4.59 (2.66%) | 0.999 |
Daily GHI
| CAMS-Radiation -- GHI Quality assessment results vs. the stations DAILY IRRADIATION |
||||||
| Station | Number of values | Mean station (Wh/m2) |
Bias (Wh/m2) (relative in %) |
STDEV (Wh/m2) (relative in %) |
RMSE (Wh/m2) (relative in %) |
Correl. coeff. |
| Lerwick | 3718 | 2284.88 | -64.24 (-2.81%) | 522.89 (22.88%) | 526.82 (23.06%) | 0.966 |
| Toravere | 5044 | 2553.20 | -9.99 (-0.39%) | 445.95 (17.47%) | 446.06 (17.47%) | 0.980 |
| Lindenberg | 4694 | 3028.71 | 40.99 (1.35%) | 410.60 (13.56%) | 412.64 (13.62%) | 0.984 |
| Cabauw | 4873 | 3039.46 | 153.78 (5.06%) | 398.40 (13.11%) | 427.05 (14.05%) | 0.984 |
| Camborne | 3470 | 3110.71 | 110.99 (3.57%) | 506.24 (16.27%) | 518.27 (16.66%) | 0.974 |
| Palaiseau | 4428 | 3262.90 | 108.26 (3.32%) | 398.89 (12.22%) | 413.32 (12.67%) | 0.984 |
| Sonnblick | 1603 | 3714.98 | -53.06 (-1.43%) | 1051.07 (28.29%) | 1052.41 (28.33%) | 0.875 |
| Payerne | 3416 | 3379.72 | 152.33 (4.51%) | 400.91 (11.86%) | 428.87 (12.69%) | 0.986 |
| Carpentras | 4889 | 4349.36 | 56.15 (1.29%) | 331.12 (7.61%) | 335.84 (7.72%) | 0.991 |
| Cener | 3121 | 4022.43 | 57.51 (1.43%) | 485.26 (12.06%) | 488.66 (12.15%) | 0.979 |
| ENA, Azores | 18 | 2977.59 | -99.14 (-3.33%) | 97.44 (3.27%) | 139.01 (4.67%) | 0.992 |
| Sede Boqer | 2871 | 5774.59 | -189.68 (-3.28%) | 376.00 (6.51%) | 421.14 (7.29%) | 0.984 |
| Izana, Tenerife | 3393 | 6713.59 | -162.17 (-2.42%) | 850.42 (12.67%) | 865.74 (12.90%) | 0.916 |
| Tamanrasset | 4795 | 5909.86 | -181.06 (-3.06%) | 422.69 (7.15%) | 459.84 (7.78%) | 0.961 |
| Ilorin | 366 | 4557.47 | 327.22 (7.18%) | 450.67 (9.89%) | 556.93 (12.22%) | 0.850 |
| Petrolina | 2897 | 5509.75 | 288.88 (5.24%) | 396.44 (7.20%) | 490.53 (8.90%) | 0.956 |
| Brasilia | 2020 | 5250.32 | 180.29 (3.43%) | 561.72 (10.70%) | 589.94 (11.24%) | 0.914 |
| Gobabeb | 2276 | 6578.97 | -322.38 (-4.90%) | 288.43 (4.38%) | 432.57 (6.58%) | 0.985 |
| Florianopolis | 1647 | 4291.22 | 25.32 (0.59%) | 610.55 (14.23%) | 611.08 (14.24%) | 0.955 |
| Sao Martinho da Serra | 2934 | 4745.82 | -17.71 (-0.37%) | 500.38 (10.54%) | 500.69 (10.55%) | 0.978 |
| De Aar | 1575 | 5779.27 | -130.86 (-2.26%) | 335.44 (5.80%) | 360.06 (6.23%) | 0.988 |
Hourly GHI
| CAMS-Radiation -- GHI Quality assessment results vs. the stations HOURLY IRRADIATION |
||||||
| Station | Number of values | Mean station (Wh/m2) |
Bias (Wh/m2) (relative in %) |
STDEV (Wh/m2) (relative in %) |
RMSE (Wh/m2) (relative in %) |
Correl. coeff. |
| Lerwick | 43011 | 197.47 | -5.63 (-2.85%) | 76.25 (38.62%) | 76.46 (38.72%) | 0.914 |
| Toravere | 56985 | 218.94 | -0.19 (-0.09%) | 66.52 (30.38%) | 66.52 (30.38%) | 0.949 |
| Lindenberg | 55145 | 257.38 | 3.32 (1.29%) | 65.84 (25.58%) | 65.93 (25.61%) | 0.957 |
| Cabauw | 57932 | 255.63 | 12.76 (4.99%) | 62.08 (24.29%) | 63.38 (24.79%) | 0.961 |
| Camborne | 41133 | 262.38 | 9.14 (3.48%) | 76.59 (29.19%) | 77.13 (29.40%) | 0.944 |
| Palaiseau | 52259 | 276.23 | 8.97 (3.25%) | 65.19 (23.60%) | 65.80 (23.82%) | 0.961 |
| Sonnblick | 19182 | 314.70 | -5.22 (-1.66%) | 137.17 (43.59%) | 137.27 (43.62%) | 0.843 |
| Payerne | 39300 | 291.49 | 13.30 (4.56%) | 65.38 (22.43%) | 66.71 (22.89%) | 0.967 |
| Carpentras | 58998 | 360.17 | 4.47 (1.24%) | 55.04 (15.28%) | 55.23 (15.33%) | 0.980 |
| Cener | 37809 | 333.60 | 4.53 (1.36%) | 73.57 (22.05%) | 73.71 (22.09%) | 0.963 |
| ENA, Azores | 367 | 234.29 | -7.92 (-3.38%) | 39.46 (16.84%) | 40.25 (17.18%) | 0.985 |
| Sede Boqer | 32177 | 519.75 | -17.22 (-3.31%) | 58.25 (11.21%) | 60.74 (11.69%) | 0.982 |
| Izana, Tenerife | 41560 | 545.29 | -12.65 (-2.32%) | 101.89 (18.69%) | 102.67 (18.83%) | 0.955 |
| Tamanrasset | 58579 | 495.40 | -15.93 (-3.22%) | 68.49 (13.83%) | 70.32 (14.19%) | 0.978 |
| Ilorin | 4103 | 464.48 | 30.25 (6.51%) | 84.87 (18.27%) | 90.10 (19.40%) | 0.947 |
| Petrolina | 34940 | 457.28 | 24.04 (5.26%) | 75.28 (16.46%) | 79.02 (17.28%) | 0.972 |
| Brasilia | 24851 | 435.29 | 19.21 (4.41%) | 120.77 (27.74%) | 122.29 (28.09%) | 0.921 |
| Gobabeb | 28380 | 527.30 | -25.84 (-4.90%) | 44.32 (8.41%) | 51.31 (9.73%) | 0.992 |
| Florianopolis | 19369 | 364.87 | 2.18 (0.60%) | 103.27 (28.30%) | 103.29 (28.31%) | 0.935 |
| Sao Martinho da Serra | 35327 | 395.20 | -1.65 (-0.42%) | 85.16 (21.55%) | 85.18 (21.55%) | 0.961 |
| De Aar | 18301 | 498.45 | -11.29 (-2.26%) | 59.40 (11.92%) | 60.47 (12.13%) | 0.983 |
15 min GHI
| CAMS-Radiation -- GHI Quality assessment results vs. the stations 15 MIN IRRADIATION |
||||||
| Station | Number of values | Mean station (Wh/m2) |
Bias (Wh/m2) (relative in %) |
STDEV (Wh/m2) (relative in %) |
RMSE (Wh/m2) (relative in %) |
Correl. coeff. |
| Lerwick | 170231 | 50.18 | -1.37 (-2.74%) | 23.21 (46.25%) | 23.25 (46.33%) | 0.879 |
| Toravere | 223906 | 58.95 | -0.29 (-0.49%) | 22.20 (37.65%) | 22.20 (37.66%) | 0.921 |
| Lindenberg | 214543 | 66.31 | 0.91 (1.37%) | 22.09 (33.31%) | 22.11 (33.34%) | 0.926 |
| Cabauw | 224305 | 66.26 | 3.35 (5.06%) | 20.91 (31.57%) | 21.18 (31.97%) | 0.933 |
| Camborne | 159715 | 67.74 | 2.41 (3.56%) | 23.83 (35.18%) | 23.95 (35.36%) | 0.917 |
| Palaiseau | 203241 | 71.22 | 2.38 (3.34%) | 22.13 (31.07%) | 22.25 (31.25%) | 0.932 |
| Sonnblick | 74241 | 84.80 | -1.52 (-1.79%) | 39.96 (47.12%) | 39.99 (47.16%) | 0.801 |
| Payerne | 154191 | 76.33 | 3.43 (4.50%) | 21.60 (28.29%) | 21.87 (28.65%) | 0.945 |
| Carpentras | 226819 | 93.79 | 1.22 (1.30%) | 17.84 (19.03%) | 17.89 (19.07%) | 0.966 |
| Cener | 144858 | 87.53 | 1.23 (1.41%) | 23.75 (27.13%) | 23.78 (27.17%) | 0.939 |
| ENA, Azores | 1637 | 68.33 | -2.86 (-4.19%) | 15.99 (23.40%) | 16.25 (23.78%) | 0.963 |
| Sede Boqer | 127734 | 133.31 | -4.45 (-3.34%) | 18.17 (13.63%) | 18.71 (14.03%) | 0.972 |
| Izana, Tenerife | 156756 | 145.82 | -3.41 (-2.34%) | 29.29 (20.09%) | 29.49 (20.22%) | 0.939 |
| Tamanrasset | 226409 | 131.28 | -4.31 (-3.28%) | 22.70 (17.29%) | 23.11 (17.60%) | 0.961 |
| Ilorin | 17219 | 117.29 | 7.75 (6.61%) | 27.82 (23.72%) | 28.88 (24.63%) | 0.916 |
| Petrolina | 133429 | 121.21 | 6.37 (5.26%) | 26.44 (21.82%) | 27.20 (22.44%) | 0.941 |
| Brasilia | 95866 | 114.77 | 5.32 (4.63%) | 39.72 (34.61%) | 40.08 (34.92%) | 0.867 |
| Gobabeb | 106448 | 140.76 | -6.90 (-4.90%) | 14.08 (10.00%) | 15.68 (11.14%) | 0.985 |
| Florianopolis | 75344 | 94.03 | 0.66 (0.70%) | 31.79 (33.81%) | 31.80 (33.82%) | 0.905 |
| Sao Martinho da Serra | 135035 | 104.11 | -0.35 (-0.34%) | 28.08 (26.97%) | 28.08 (26.98%) | 0.934 |
| De Aar | 70301 | 130.62 | -2.96 (-2.27%) | 20.77 (15.90%) | 20.98 (16.06%) | 0.965 |
Monthly DNI
| CAMS-Radiation -- DNI Quality assessment results vs. the stations MONTHLY IRRADIATION |
||||||
| Station | Number of values | Mean station (kWh/m2) |
Bias (kWh/m2) (relative in %) |
STDEV (kWh/m2) (relative in %) |
RMSE (kWh/m2) (relative in %) |
Correl. coeff. |
| Lerwick | 16 | 84.43 | -19.32 (-22.88%) | 6.85 (8.12%) | 20.49 (24.27%) | 0.962 |
| Toravere | 80 | 135.95 | -22.55 (-16.58%) | 11.50 (8.46%) | 25.31 (18.62%) | 0.957 |
| Lindenberg | 100 | 114.60 | -6.06 (-5.29%) | 7.34 (6.41%) | 9.52 (8.31%) | 0.981 |
| Cabauw | 97 | 101.07 | 6.86 (6.79%) | 6.57 (6.50%) | 9.50 (9.40%) | 0.979 |
| Camborne | 65 | 96.69 | 6.17 (6.38%) | 7.27 (7.52%) | 9.53 (9.86%) | 0.976 |
| Palaiseau | 95 | 109.87 | 1.78 (1.62%) | 7.52 (6.84%) | 7.72 (7.03%) | 0.978 |
| Sonnblick | 27 | 119.76 | -0.18 (-0.15%) | 31.94 (26.67%) | 31.94 (26.67%) | 0.480 |
| Payerne | 58 | 136.64 | 1.61 (1.18%) | 7.61 (5.57%) | 7.78 (5.70%) | 0.979 |
| Carpentras | 163 | 156.05 | -5.15 (-3.30%) | 5.85 (3.75%) | 7.80 (5.00%) | 0.995 |
| Cener | 90 | 135.60 | -3.45 (-2.54%) | 9.64 (7.11%) | 10.24 (7.55%) | 0.982 |
| ENA, Azores | 0 | NaN | NaN (NaN%) | NaN (NaN%) | NaN (NaN%) | NaN |
| Sede Boqer | 97 | 183.32 | -26.75 (-14.59%) | 13.05 (7.12%) | 29.76 (16.23%) | 0.974 |
| Izana, Tenerife | 112 | 258.10 | -16.76 (-6.49%) | 29.92 (11.59%) | 34.29 (13.29%) | 0.904 |
| Tamanrasset | 159 | 174.28 | 1.85 (1.06%) | 20.05 (11.50%) | 20.13 (11.55%) | 0.915 |
| Ilorin | 0 | NaN | NaN (NaN%) | NaN (NaN%) | NaN (NaN%) | NaN |
| Petrolina | 79 | 136.46 | 13.17 (9.65%) | 8.04 (5.89%) | 15.43 (11.31%) | 0.973 |
| Brasilia | 46 | 139.62 | 3.51 (2.51%) | 6.84 (4.90%) | 7.69 (5.50%) | 0.991 |
| Gobabeb | 76 | 242.76 | -31.46 (-12.96%) | 8.89 (3.66%) | 32.69 (13.47%) | 0.970 |
| Florianopolis | 41 | 112.11 | -0.12 (-0.11%) | 7.76 (6.93%) | 7.77 (6.93%) | 0.946 |
| Sao Martinho da Serra | 43 | 135.30 | -7.24 (-5.35%) | 9.28 (6.86%) | 11.78 (8.70%) | 0.965 |
| De Aar | 53 | 226.95 | -14.82 (-6.53%) | 9.11 (4.01%) | 17.40 (7.67%) | 0.980 |
Daily DNI
| CAMS-Radiation -- DNI Quality assessment results vs. the stations DAILY IRRADIATION |
||||||
| Station | Number of values | Mean station (Wh/m2) |
Bias (Wh/m2) (relative in %) |
STDEV (Wh/m2) (relative in %) |
RMSE (Wh/m2) (relative in %) |
Correl. coeff. |
| Lerwick | 851 | 3794.42 | -1064.67 (-28.06%) | 1145.26 (30.18%) | 1563.70 (41.21%) | 0.876 |
| Toravere | 1892 | 6027.86 | -1266.08 (-21.00%) | 1038.55 (17.23%) | 1637.54 (27.17%) | 0.935 |
| Lindenberg | 2231 | 5167.14 | -408.84 (-7.91%) | 847.53 (16.40%) | 940.99 (18.21%) | 0.944 |
| Cabauw | 2316 | 4707.07 | 70.11 (1.49%) | 866.41 (18.41%) | 869.24 (18.47%) | 0.939 |
| Camborne | 1482 | 4599.24 | 93.96 (2.04%) | 1026.76 (22.32%) | 1031.05 (22.42%) | 0.921 |
| Palaiseau | 2109 | 5069.97 | -74.91 (-1.48%) | 868.18 (17.12%) | 871.40 (17.19%) | 0.942 |
| Sonnblick | 738 | 6200.25 | -721.13 (-11.63%) | 2390.22 (38.55%) | 2496.63 (40.27%) | 0.701 |
| Payerne | 1434 | 6124.39 | -92.76 (-1.51%) | 876.90 (14.32%) | 881.79 (14.40%) | 0.940 |
| Carpentras | 3684 | 6654.60 | -264.00 (-3.97%) | 722.23 (10.85%) | 768.97 (11.56%) | 0.962 |
| Cener | 1948 | 6125.59 | -234.58 (-3.83%) | 889.86 (14.53%) | 920.26 (15.02%) | 0.946 |
| ENA, Azores | 14 | 4798.62 | -251.86 (-5.25%) | 458.45 (9.55%) | 523.08 (10.90%) | 0.869 |
| Sede Boqer | 2621 | 6661.27 | -955.97 (-14.35%) | 978.58 (14.69%) | 1368.03 (20.54%) | 0.903 |
| Izana, Tenerife | 3029 | 9477.09 | -703.50 (-7.42%) | 2417.75 (25.51%) | 2518.02 (26.57%) | 0.586 |
| Tamanrasset | 3836 | 6658.53 | 9.95 (0.15%) | 1187.55 (17.84%) | 1187.60 (17.84%) | 0.879 |
| Ilorin | 0 | NaN | NaN (NaN%) | NaN (NaN%) | NaN (NaN%) | NaN |
| Petrolina | 2112 | 5803.99 | 556.66 (9.59%) | 866.31 (14.93%) | 1029.74 (17.74%) | 0.904 |
| Brasilia | 1139 | 5752.45 | 137.49 (2.39%) | 885.75 (15.40%) | 896.36 (15.58%) | 0.916 |
| Gobabeb | 2180 | 8343.83 | -1091.18 (-13.08%) | 719.27 (8.62%) | 1306.91 (15.66%) | 0.916 |
| Florianopolis | 846 | 5544.20 | -41.45 (-0.75%) | 1071.57 (19.33%) | 1072.37 (19.34%) | 0.890 |
| Sao Martinho da Serra | 1188 | 6607.85 | -304.82 (-4.61%) | 1127.28 (17.06%) | 1167.77 (17.67%) | 0.904 |
| De Aar | 1427 | 8208.20 | -535.95 (-6.53%) | 718.53 (8.75%) | 896.39 (10.92%) | 0.962 |
Hourly DNI
| CAMS-Radiation -- DNI Quality assessment results vs. the stations HOURLY IRRADIATION |
||||||
| Station | Number of values | Mean station (Wh/m2) |
Bias (Wh/m2) (relative in %) |
STDEV (Wh/m2) (relative in %) |
RMSE (Wh/m2) (relative in %) |
Correl. coeff. |
| Lerwick | 14465 | 305.83 | -82.33 (-26.92%) | 181.44 (59.33%) | 199.25 (65.15%) | 0.694 |
| Toravere | 29863 | 452.95 | -96.20 (-21.24%) | 163.40 (36.07%) | 189.61 (41.86%) | 0.827 |
| Lindenberg | 31654 | 404.25 | -29.10 (-7.20%) | 138.56 (34.28%) | 141.58 (35.02%) | 0.862 |
| Cabauw | 33851 | 366.11 | 13.07 (3.57%) | 133.37 (36.43%) | 134.01 (36.60%) | 0.863 |
| Camborne | 20952 | 368.25 | 13.36 (3.63%) | 159.28 (43.25%) | 159.84 (43.40%) | 0.819 |
| Palaiseau | 29844 | 398.41 | 0.44 (0.11%) | 134.64 (33.79%) | 134.64 (33.79%) | 0.874 |
| Sonnblick | 10922 | 490.17 | -33.24 (-6.78%) | 320.24 (65.33%) | 321.96 (65.68%) | 0.608 |
| Payerne | 21037 | 481.75 | -1.47 (-0.30%) | 139.01 (28.86%) | 139.02 (28.86%) | 0.883 |
| Carpentras | 45865 | 553.08 | -20.41 (-3.69%) | 114.26 (20.66%) | 116.07 (20.99%) | 0.920 |
| Cener | 26383 | 485.94 | -15.21 (-3.13%) | 140.82 (28.98%) | 141.64 (29.15%) | 0.891 |
| ENA, Azores | 234 | 515.14 | -34.64 (-6.72%) | 114.19 (22.17%) | 119.33 (23.16%) | 0.912 |
| Sede Boqer | 29004 | 606.16 | -85.50 (-14.11%) | 144.40 (23.82%) | 167.81 (27.68%) | 0.877 |
| Izana, Tenerife | 37340 | 773.96 | -55.43 (-7.16%) | 251.09 (32.44%) | 257.14 (33.22%) | 0.681 |
| Tamanrasset | 48043 | 573.25 | 4.84 (0.84%) | 149.89 (26.15%) | 149.97 (26.16%) | 0.889 |
| Ilorin | 0 | NaN | NaN (NaN%) | NaN (NaN%) | NaN (NaN%) | NaN |
| Petrolina | 24984 | 498.85 | 47.15 (9.45%) | 150.80 (30.23%) | 158.00 (31.67%) | 0.866 |
| Brasilia | 14551 | 490.16 | 10.60 (2.16%) | 162.21 (33.09%) | 162.55 (33.16%) | 0.851 |
| Gobabeb | 26215 | 701.52 | -92.47 (-13.18%) | 98.80 (14.08%) | 135.32 (19.29%) | 0.946 |
| Florianopolis | 10183 | 507.97 | -7.79 (-1.53%) | 184.64 (36.35%) | 184.80 (36.38%) | 0.818 |
| Sao Martinho da Serra | 15550 | 528.65 | -12.74 (-2.41%) | 198.26 (37.50%) | 198.67 (37.58%) | 0.809 |
| De Aar | 16738 | 708.34 | -45.93 (-6.48%) | 112.78 (15.92%) | 121.78 (17.19%) | 0.937 |
15 min DNI
| CAMS-Radiation -- DNI Quality assessment results vs. the stations 15 MIN IRRADIATION |
||||||
| Station | Number of values | Mean station (Wh/m2) |
Bias (Wh/m2) (relative in %) |
STDEV (Wh/m2) (relative in %) |
RMSE (Wh/m2) (relative in %) |
Correl. coeff. |
| Lerwick | 62347 | 73.61 | -18.49 (-25.12%) | 56.29 (76.47%) | 59.25 (80.49%) | 0.599 |
| Toravere | 126857 | 113.65 | -23.50 (-20.68%) | 52.01 (45.77%) | 57.08 (50.22%) | 0.756 |
| Lindenberg | 129615 | 100.83 | -6.29 (-6.24%) | 45.46 (45.09%) | 45.90 (45.52%) | 0.786 |
| Cabauw | 137259 | 92.16 | 4.84 (5.25%) | 43.67 (47.38%) | 43.93 (47.67%) | 0.789 |
| Camborne | 85170 | 92.13 | 4.99 (5.41%) | 50.36 (54.66%) | 50.61 (54.93%) | 0.742 |
| Palaiseau | 121920 | 99.51 | 1.24 (1.24%) | 44.24 (44.46%) | 44.26 (44.48%) | 0.803 |
| Sonnblick | 44742 | 124.32 | -3.49 (-2.81%) | 94.23 (75.79%) | 94.29 (75.85%) | 0.511 |
| Payerne | 88243 | 120.38 | 1.04 (0.87%) | 45.44 (37.75%) | 45.45 (37.76%) | 0.819 |
| Carpentras | 182552 | 140.28 | -4.62 (-3.30%) | 37.07 (26.42%) | 37.36 (26.63%) | 0.870 |
| Cener | 105598 | 123.32 | -2.79 (-2.26%) | 45.85 (37.18%) | 45.93 (37.25%) | 0.826 |
| ENA, Azores | 1149 | 132.41 | -9.09 (-6.87%) | 40.54 (30.61%) | 41.54 (31.37%) | 0.839 |
| Sede Boqer | 117127 | 155.25 | -22.61 (-14.56%) | 42.03 (27.07%) | 47.73 (30.74%) | 0.831 |
| Izana, Tenerife | 142921 | 204.61 | -13.69 (-6.69%) | 71.90 (35.14%) | 73.19 (35.77%) | 0.552 |
| Tamanrasset | 190748 | 148.48 | 1.90 (1.28%) | 44.20 (29.77%) | 44.24 (29.80%) | 0.846 |
| Ilorin | 0 | NaN | NaN (NaN%) | NaN (NaN%) | NaN (NaN%) | NaN |
| Petrolina | 96929 | 130.02 | 13.01 (10.01%) | 49.58 (38.13%) | 51.26 (39.42%) | 0.777 |
| Brasilia | 57904 | 127.54 | 3.79 (2.97%) | 54.06 (42.39%) | 54.20 (42.49%) | 0.754 |
| Gobabeb | 98730 | 186.87 | -24.21 (-12.96%) | 31.52 (16.87%) | 39.75 (21.27%) | 0.890 |
| Florianopolis | 43158 | 122.22 | -0.54 (-0.44%) | 57.17 (46.78%) | 57.17 (46.78%) | 0.759 |
| Sao Martinho da Serra | 61077 | 137.07 | -1.47 (-1.07%) | 61.58 (44.93%) | 61.60 (44.94%) | 0.716 |
| De Aar | 64990 | 185.12 | -12.07 (-6.52%) | 40.09 (21.66%) | 41.87 (22.62%) | 0.863 |
Validation of previous versions of CAMS Radiation Service:
Validation of CAMS Radiation Service 3.0 against 14 BSRN stations (Oct. 2017)